Name of this file: Cuaderno20120620T101255.m
I do the fit more or less by hand, looking at the errors as a function of a single parameter.
load datos_shortcuts
% a=10.^(-3:.2:3);
% s=1+10.^(-3:.2:3);
% k=0:.05:1;
% p_rand=0:.05:1;
% % caca
% tic
% histog_exp=datos.histog(:,1:3);
% for c_casos=1:3
% histog_exp(:,c_casos)=histog_exp(:,c_casos)/sum(histog_exp(:,c_casos));
% end
% clear errores
% for c_params=1:length(a)
% for c_casos=1:3
% [prop,ramaelegida]=simulahormigas(.5,datos.r(c_casos),20,5,1.063,1,.1,50);
% histog_act=hist(prop,datos.bins)’;
% histog_act=histog_act/sum(histog_act);
% errores(c_params,c_casos)=mean(abs(histog_act-histog_exp(:,c_casos)));
% end
% end
% toc
Best fit
for c_casos=1:3
[prop,ramaelegida]=simulahormigas(.5,datos.r(c_casos),20,5,1.06,1,.1,100);
histog_act=hist(prop,datos.bins)’;
histog_act=histog_act/sum(histog_act);
figure
bar(datos.bins,histog_exp(:,c_casos))
hold on
plot(datos.bins,histog_act,’r’)
ylim([0 1])
end


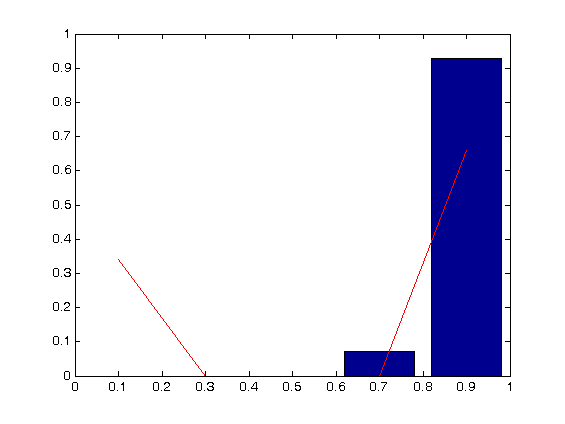
Quite bad.
