Name of this file: Cuaderno20120425T143135.m
Definitions
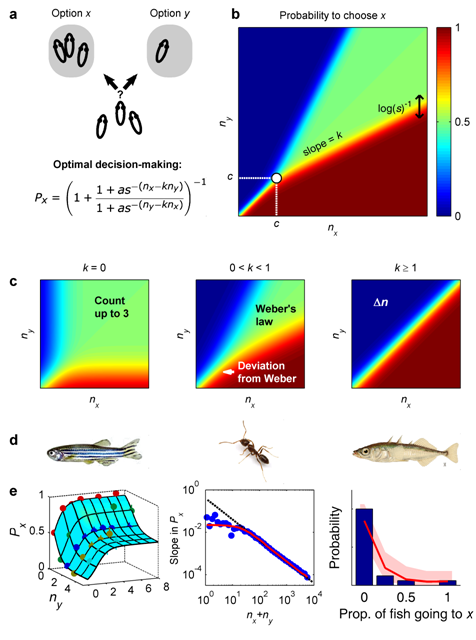
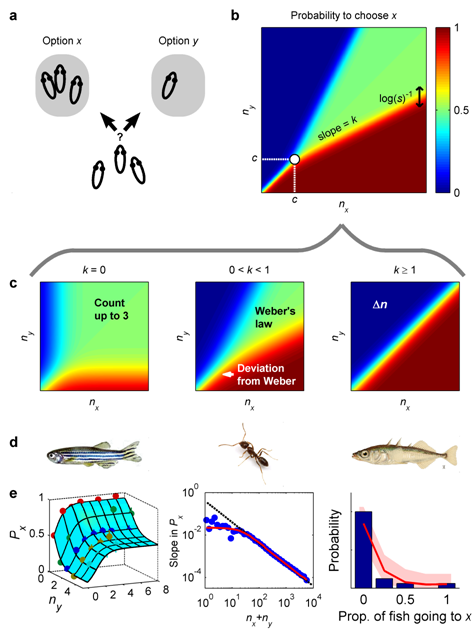
P=@(a,s,k,nx,ny) (1+(1+a*s.^-(nx-k*ny))./(1+a*s.^-(ny-k*nx))).^-1;
nx=1:.1:30;
nx=repmat(nx,[length(nx) 1]);
Plot
a=.01;
s=2;
k=1.5;
imagesc(P(a,s,k,nx,nx’))
set(gca,’YDir’,’normal’)

Indeed, we can have different things.